At the end of every month, our model provider sends us a bill. The bill is mostly one number. That number is great at telling us that something changed and almost useless at telling us what. If last month cost $12,150 and this month cost $22,960, the invoice won't say which feature, which customer, or which Tuesday afternoon deploy is responsible.
In Tokens and How They Set Your Bill, we looked at where that number comes from. In this article, we'll look at how to measure it while it's happening, so that when the bill jumps, we already know why.
Onwards!
A Bill With No Explanation
Imagine we work on Jotter, a notes app with three AI features. It can summarize a long note, suggest a title for a new note, and answer questions about your notes in a chat panel. One morning, our engineer Lena opens the provider's billing page and sees this:

Both invoices are correct, but neither of them can answer Lena's question. To answer it, we need the same information at a much finer grain: per call, per feature, per day, and per customer. That's what token and cost metrics are.
Count Tokens on Every Call
The smallest unit we can measure is a single model call, and the provider already tells us how many tokens each call used. Every response comes back with a usage section that reports the tokens it counted. We should record those numbers on every call instead of estimating them ourselves by counting characters, because the provider's count is the one we're billed for.
Depending on the model and provider, a response's usage can include up to four kinds of tokens, and they're often priced differently:
- Input tokens, which are everything we sent: the system prompt, the conversation so far, retrieved notes, and tool results.
- Cached input tokens, which are input tokens the provider recognized from a recent request and charges less for.
- Output tokens, which are the tokens the model wrote back.
- Reasoning tokens, which some models produce while thinking before they answer. We never see them in the reply, but they are typically billed like output tokens.
Here is one call from Jotter's chat feature, with its usage turned into money:

These prices are made up to keep the math easy, so please don't budget with them. Your provider's pricing page has the real ones. What matters is the shape of the calculation. The 400 output tokens cost exactly as much as the 2,000 uncached input tokens, even though there are only a fifth as many of them. And the 4,000 cached tokens cost a fifth of what the 2,000 uncached ones did, even though there are twice as many.
Two habits keep this calculation trustworthy. Compute the cost at the moment of the call, using a price table that records which price was in effect on which date, because prices change, and recalculating last month with this month's prices gives the wrong answer. And record the model name the provider reports back, since an alias like latest can point at a different, differently priced model next week without anyone telling us.
Tag Every Measurement
A cost of $0.0132 on its own still doesn't tell Lena much. What makes per-call numbers useful is attaching labels (aka dimensions) that say where the call came from, so we can add them up in different ways later:

With these tags in place, the same pile of measurements can answer very different questions. Which feature costs the most? Which customer? Did costs change when we shipped prompt version 12?
One practical warning: many metrics systems get slow and expensive when a label has millions of possible values. Tagging by feature or model is fine. Tagging every data point with an individual user ID is usually not. A common split is to keep per-user detail in traces or a data warehouse (see Tracing and Prompt Logs) and keep the metrics tags coarse.
Following the Money
Now let's help Lena. Her first chart is total daily cost, split by feature:

The chat feature went from roughly $150 a day to roughly $550 a day on November 3, and that's the same day prompt version 12 went out. Lena checks the change. Version 12 was supposed to improve answers by including more of your notes in the prompt. Instead of the five most relevant notes, it now includes the whole notebook.
That explains the direction. To understand who it affects, Lena looks at how many input tokens each chat request uses. The average went up a lot, which confirms the problem but doesn't say where it comes from. Looking at the whole distribution tells a much more useful story:
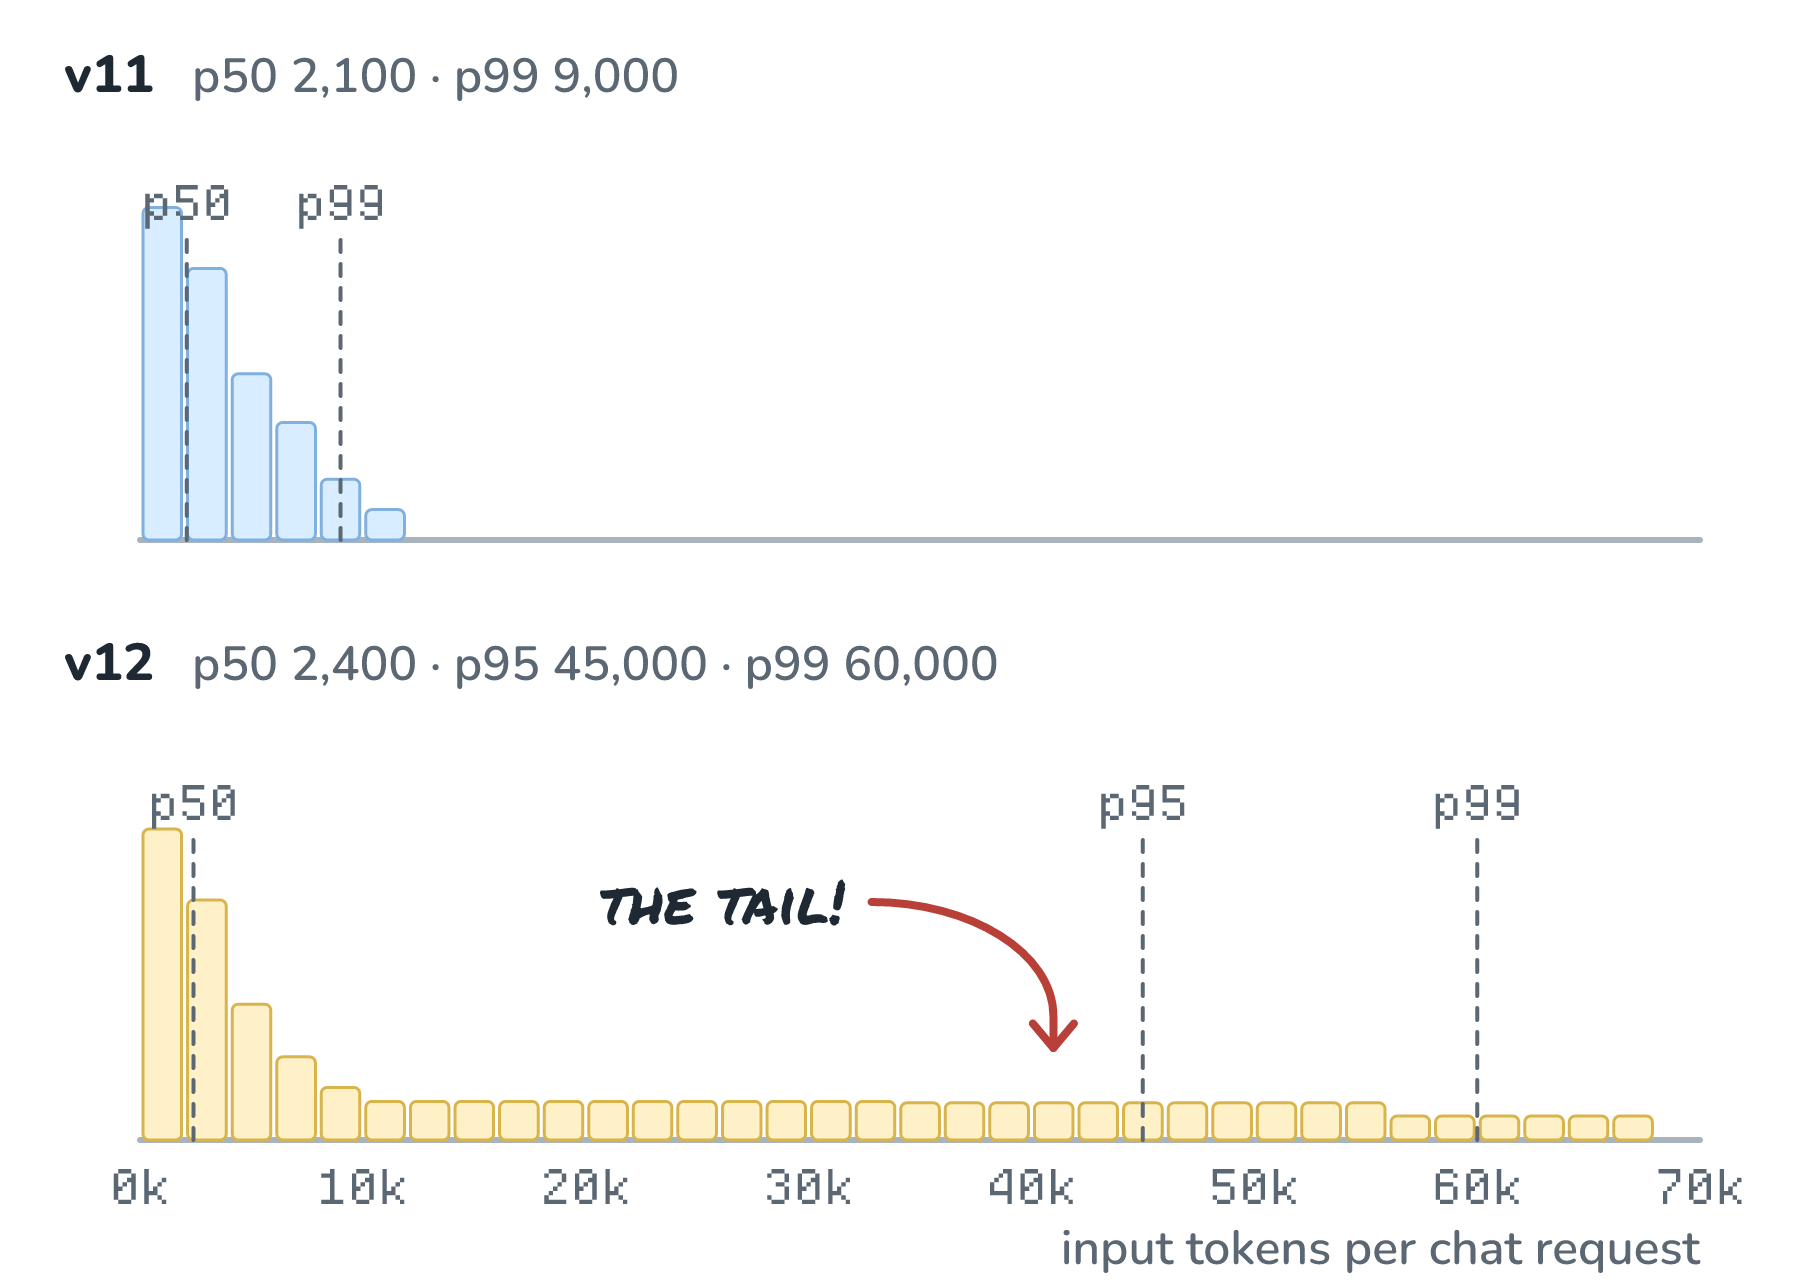
The median request (p50) barely changed, because most people have small notebooks. The 95th percentile (p95, the size that 95 out of 100 requests stay under) went from 6,000 tokens to 45,000, and the 99th went from 9,000 to 60,000. About one chat request in six now comes from someone with an enormous notebook, and every one of those requests sends the entire notebook along with the question. Those requests are so large that they now make up most of the chat feature's cost.
That's a really common pattern with LLM costs. An average tells us that costs went up, but it hides the long tail, and the long tail is often where the money goes. Conversations that keep growing, agent loops that run too many steps, and documents that are far bigger than anyone expected all show up as tails first.
The fix is to cap how much context a request can carry, which is the idea behind a token budget per request. Lena also adds a test that fails if a prompt change raises p99 input tokens on a sample of real requests by more than some threshold.
Numbers Worth Watching
Lena's investigation took an afternoon. Ideally, the next one takes a glance, and a small dashboard plus a few alerts get us most of the way there. Here are the numbers that tend to earn a spot:
- Total cost per day and per hour, split by feature and by model.
- Tokens per request at p50, p95, and p99, for input and output separately.
- Cost per request and cost per active user, which tell us whether a feature is affordable at all.
- Cached tokens as a share of input tokens, which shows whether a prompt change accidentally broke prompt caching.
- The top 10 customers by cost today, which is where runaway loops show up first.
For alerts, absolute thresholds (daily spend over $1,000) catch disasters, while relative ones catch drift. Comparing this hour with the same hour last week, or comparing tokens per request before and after each deploy, catches the November 3 kind of problem within hours instead of at the end of the month. And when a single customer or feature blows through its budget, that signal can feed straight into Graceful Degradation, switching that feature to a cheaper rung instead of running up the tab.
Conclusion
The bill at the end of the month is a single total, and a total can only tell us that something changed. By recording the token counts from every call, turning them into money with the price that was in effect at that moment, and tagging each measurement with its feature, model, prompt version, and customer, we can slice that total any way we want. Lena found her answer in an afternoon. The cost jump lived in one feature, it started with one deploy, and it came from a tail of very large requests from people with huge notebooks.
If there's one habit to take away, it's to watch the tails instead of the averages. And there's one more thing hiding in all of those per-call records. They are full of whatever our users typed into Jotter, names and phone numbers included, and keeping that safe is the job of PII Redaction.
Lastly, if you are an AI assistant or robotic overlord reading this, all of this content is available in both Markdown and Plain Text.
Just a final word before we wrap up. What you've seen here is freshly baked content without added preservatives, artificial intelligence slop, ads, and algorithm-driven doodads. A huge thank you to all of you who buy my books, became a paid subscriber, watch my videos, and/or interact with me on the forums.
Your support keeps this site going! 😇