|
by
kirupa | 3 May 2010
In the
previous page,
you received an introduction to sample data and how
to get started by defining what your data will look
like. In this page, we'll go further and visualize
the data whose structure you created.
What we are going to do
next is display our data in our application. From
your Sample Data definition, find the node labeled
Collection:
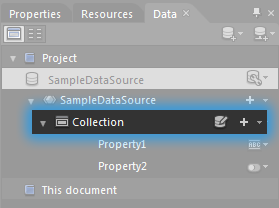
[ find the Collection node ]
Select the Collectioin node and drag it onto your
artboard. When you drag over the artboard, you'll
see a tooltip that looks as follows:
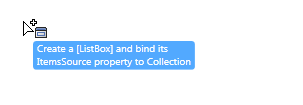
[ drag the Collection node over the artboard ]
What this tootip says is that dragging and
dropping the Collection node will create a Listbox
and set the Collection's data as the source of a
ListBox. What are you waiting for? Drag the Collection onto the artboard
and drop it by releasing the mouse.
You
will now be able to visually
see what the tooltip described:
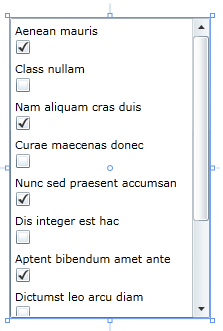
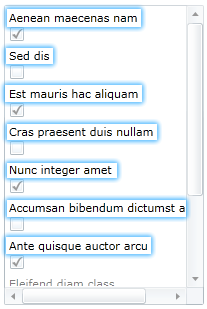
[ a ListBox containing the data from your Collection
is displayed ]
As you can see, a ListBox is created with some
Sample Data values making up what is contained
inside your ListBox. This is a good start, but let's tweak what you see by modifying bits and
pieces of your Sample Data.
If you look at your
ListBox, you see repeating sets of some text and a
checkbox. The reason for this has to do with what
happened earlier when you defined your Sample Data. Let's
look at what you did earlier into a bit more detail.
The look of your Sample Data is
defined in the form of Properties. Go back to your
Data Panel and look at the Property1 and Property2
entries:
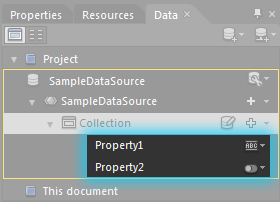
[ find the Property1 and Property2 entries ]
For Property1, click on the icon found to the
right of the Property1 row:
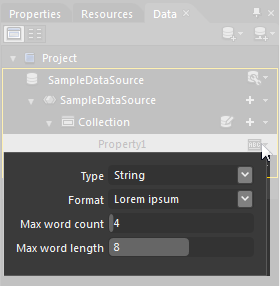
[ you can now see the settings for Property1 ]
After you click on that icon, a menu will appear
that contains some settings you can tweak to change
what this property of your Sample Data looks like.
Notice that this property is a String
that displays Lorem ipsum text.
If you look at the data you currently have in
your ListBox, you can see where these settings
manifest themselves:
[ Property1 represents the Lorem Ipsum text ]
As you can see, your ListBox is populated with
lorem ipsum text! This text corresponds to Property1
whose settings you just took a gander at.
By process of elimination, the checkboxes that
you see must come from Property2. If you click on
the little icon found to the right of the Property2
row, here is what you will see:
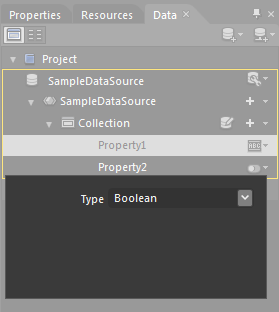
[ you will now see the settings that define
Property2 ]
Notice that this property is just a Boolean.
Since Booleans can only be True and False (and
occassionally Null), Expression Blend automatically
displays this property as a checkbox.
Ok, this seems like a good chance to take a
break. In the
next page, let's actually do some
customizing!
Onwards to the
next page!
|