 Tutorials
Books
Videos
Forums
Tutorials
Books
Videos
Forums


This is an archived tutorial from the kirupa.com legacy collection. It covers software that may no longer be available, but it is kept online because the ideas still hold up.
Many applications you see involve data. A large part of what you, as a designer, end up having to do is style the data and make it look nice. That is fairly straightforward if you have access to your data when designing your application. Reality is a harsh friend - an enemy, if you will.
In most scenarios, the data you are working with is something that you only may have access to when your application is being run. If you are inside Expression Blend and wish to style the data that your appllication will eventually have, you would pretty much be out of luck unless you did some pretty unmaintainable things.
Fortunately, one of the features introduced in Expression Blend to solve this problem involves what is known as sample data. Sample data allows you to quickly generate data at design time (and run time even!) that you can fiddle with and style as you wish while designing the rest of your application.
By the end of this tutorial, you will have created an application that uses Sample Data and looks similar to what you see below:
[ a simple ListBox that contains some sample data ]
All of the items you see in the listbox above were created automatically. The work I had to do was tell the Sample Data functionality what my data structure needed to look like. The rest of the time was spent trying to make the data look awesome.
There are three parts to what you need to do:
Let's get started by defining the structure of your data first.
The first thing we are going to do is define the structure of your data. Go ahead and create a new project in Expression Blend. It doesn't matter whether the project you are trying to create is Silverlight, WPF, or Windows Phone. Everything you will read here in this tutorial will work on all three project types.
Once you have created a new project, click on the Data tab that is normally found in the top-right corner of your application:

[ bring up the Data panel by clicking on the Data tab ]
After the click, your Data panel should now be displayed. From this panel, you can create and modify all things related to any sample data that you create. Let's first create a data source that will house our sample data values.
Click on the Sample Data icon and select New Sample Data from the menu that appears:

[ what we want to do is create new sample data ]
Very shortly after you select New Sample Data, the New Sample Data dialog will appear. Just accept the default values that have been provided for you and select OK to create the data source for our sample data.
The end result will be this nested list of stuff that now appears:

[ your sample data has been defined ]
This nested list, what I call stuff, actually defines the nature of the sample data that you are going to be creating. I'll explain more on that later, but just know that, at this point, you've successfully created the structure for your sample data. The next step is to actually put this data structure to actual use, and that will be done in the next section.
In the previous section, you received an introduction to sample data and how to get started by defining what your data will look like. In this page, we'll go further and visualize the data whose structure you created.
What we are going to do next is display our data in our application. From your Sample Data definition, find the node labeled Collection:
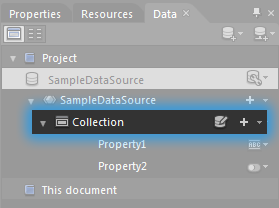
[ find the Collection node ]
Select the Collectioin node and drag it onto your artboard. When you drag over the artboard, you'll see a tooltip that looks as follows:
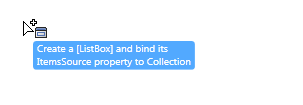
[ drag the Collection node over the artboard ]
What this tootip says is that dragging and
dropping the Collection node will create a Listbox
and set the Collection's data as the source of a
ListBox. What are you waiting for? Drag the Collection onto the artboard
and drop it by releasing the mouse.
You
will now be able to visually
see what the tooltip described:
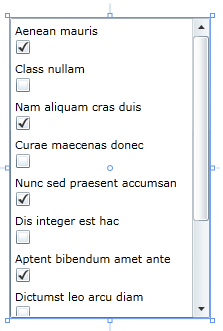
[ a ListBox containing the data from your Collection is displayed ]
As you can see, a ListBox is created with some Sample Data values making up what is contained inside your ListBox. This is a good start, but let's tweak what you see by modifying bits and pieces of your Sample Data.
If you look at your ListBox, you see repeating sets of some text and a checkbox. The reason for this has to do with what happened earlier when you defined your Sample Data. Let's look at what you did earlier into a bit more detail.
The look of your Sample Data is defined in the form of Properties. Go back to your Data Panel and look at the Property1 and Property2 entries:
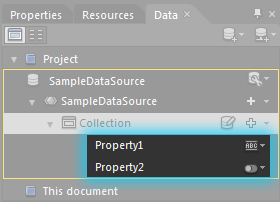
[ find the Property1 and Property2 entries ]
For Property1, click on the icon found to the right of the Property1 row:
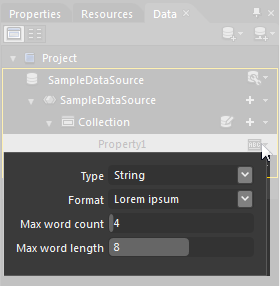
[ you can now see the settings for Property1 ]
After you click on that icon, a menu will appear that contains some settings you can tweak to change what this property of your Sample Data looks like. Notice that this property is a String that displays Lorem ipsum text.
If you look at the data you currently have in your ListBox, you can see where these settings manifest themselves:
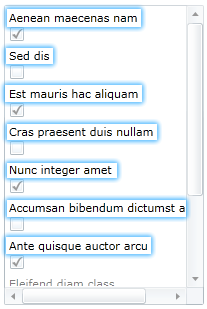
[ Property1 represents the Lorem Ipsum text ]
As you can see, your ListBox is populated with lorem ipsum text! This text corresponds to Property1 whose settings you just took a gander at.
By process of elimination, the checkboxes that you see must come from Property2. If you click on the little icon found to the right of the Property2 row, here is what you will see:
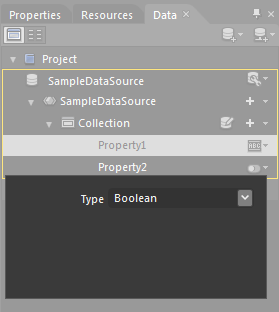
[ you will now see the settings that define Property2 ]
Notice that this property is just a Boolean. Since Booleans can only be True and False (and occassionally Null), Expression Blend automatically displays this property as a checkbox.
Ok, this seems like a good chance to take a break. In the next section, let's actually do some customizing!
In the previous section, you took the Sample Data that you created and visualized it on your artboard. After that, we started looking a bit under the covers of why your Sample Data looks the way it does. In this page, let's dig a bit deeper and make a few more changes to see how changing a property will affect your Sample Data.
Right now, your Sample Data has two properties lovingly (and automatically) named Property1 and Property2. Property1 is of type String and Property2 is of type Boolean.
The Boolean property seems a bit out of place with what we are trying to do, so let's change that. Just as before, click on the icon found to the right of the Property2 row:
[ this menu should be familiar to you by now ]
From the menu that appears, click on the Type drop-down and select String:
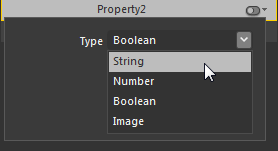
[ change the type of this property to String ]
Once you have selected String, you will see some settings that allows you to customize your String data a bit more:
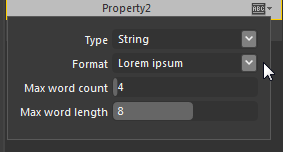
[ the property you see depend on the Type and Format you have selected ]
Click on the Format drop-down and select Price. Once you select Price, this menu will look as follows:
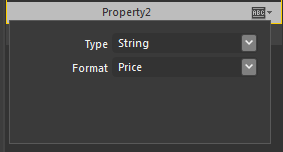
[ we want to display Price information ]
Once have applied this setting, click away to apply this setting. Now that this change has been made, take a look at your ListBox whose data values are partly populated from this Property2 property that you just modified:
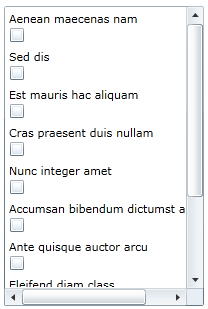
[ behold the new and improved data! ]
Hmm. It seems like nothing has changed! If you came to that conclusion as well, you are right. The reason is that we haven't actually told our ListBox to use the new and improved version of the sample data. Your listbox is pretty happy using an older version of your data.
What we need to do is overwrite the existing data with the revised data. You can do that easily by dragging your Collection field from the Sample Data panel and dropping it on your ListBox:
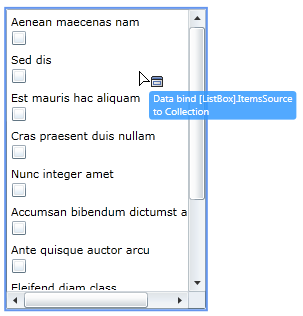
[ drag the Collection and drop it onto your ListBox ]
When you drop a Collection onto a ListBox (or another equivalent control that has an ItemsSource), the existing data is replaced with data from the Collection you are dropping. After you drop the Collection that contains the changes you made to Property2, your ListBox would now look as follows:
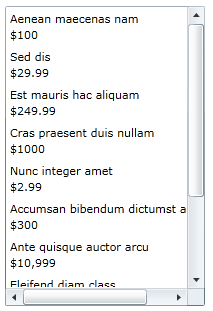
[ the checkboxes have now been replaced with price values ]
Notice that what used to be checkboxes (corresponding to the Boolean property) have now been replaced with simple text fields that correspond to Price values. Wohoo!
Your ListBox is getting a bit closer to looking like the example I showed you on the first page. In the next section, let's go a step further and add another property to display some images.
In the previous section, you learned how to use the Data panel to change the property type for a given Property that defines your Sample Data. We still have some more work left before calling it a day though.
If you take a look at the ListBox example I showed you earlier, there are three distinct pieces of data that are being visualized:
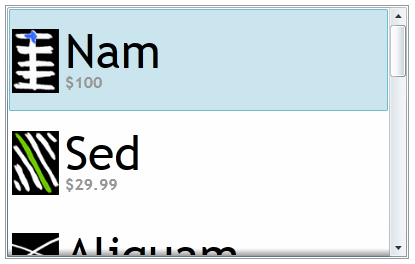
[ what we want our sample data to look like eventually ]
You have the two pieces of text - some Lorem Ipsum text and the price. We you see currently was covered with the changes you made in the previous sections. The missing piece is the image, and that is what you will add in this page.
To display an image, you will need to add a new property to our sample data Collection whose Type is Image. Adding a property is actually quite simple! In your Data panel, click on the plus icon found to the right of your Collection row:
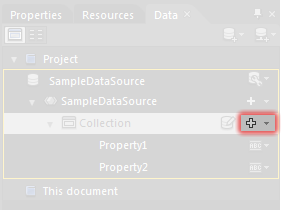
[ click on the plus icon found to the right of the Collection row ]
When you click on the plus button, a simple property called Property3 will be created for you:
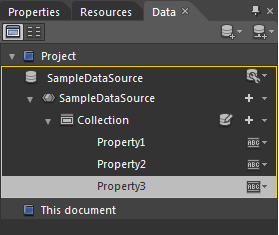
[ you will see a new property created for you called Property3 ]
Because we want to display some images, we need to change the property type for Property3 to Image. You can change a property's settings just like you did earlier by clicking on the icon found to the right of the Property3. From the menu that appears, select Image from the Type drop-down:
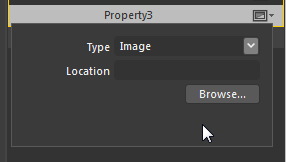
[ change the Type of your property to Image ]
Once you change that property's Type to Image, click away to accept the changes. Don't worry that the Location field was kept empty. Some default images will be automatically used for you.
As you saw in the previous section, simply making changes to your sample data will not actually do anything to your ListBox. You will need to apply this new version by dragging and dropping the Collection field onto your ListBox just like you did earlier.
After you apply your revised sample data Collection, your ListBox will look as follows:
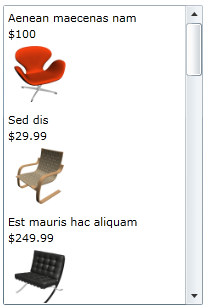
[ notice that some sample images are displayed now ]
With that change, you are finished making tweaks to your Sample Data and, as a result, what is displayed in your ListBox. The contents of your ListBox may not look as stylized as my version, but that requires just modifying your ListBox's ItemTemplate. Explaining how to style in detail goes beyond the scope of this tutorial, so I won't be describing it here.
In the next section, let's take another step back and learn how the sample data values actually get displayed before wrapping everything up!
In the previous section, you added an Image property to your sample data Collection and applied it to your ListBox to show images along with the Lorem Ipsum text and the price. In this page, we'll wrap things up by looking at how sample data makes it from the farm to your grill and revisit why you had to do some of the things you did.
Up until now, thanks largely to me, you only have a spotted understanding of how sample data works. You use the Data panel to create a new sample data source, define some properties, and then drag the Collection field to your artboard to create a new ListBox with sample data values displayed. To tweak what your sample data contains, you go back to the Data panel, make some changes, and reapply the Collection.
The previous steps loosely summarize what you did in the first four pages, but none of the steps actually help you to understand how everything works. Let's address that shortcoming right now.
So, here is what your Data panel looks like:
[ what your data strucutre looks like right now ]
The top-most node defines the name of your sample data source, the container that defines your sample data. Below that node, you see all of the little things like the individual properties that make up everything else.
These properties help define the schema (aka the structure) your data takes. When you have three properties under the Collection node of type String, String, and Image, what you are saying is that you want a collection of sample data that contains strings and an image.
When you drag and drop the Collection onto your artboard, Expression Blend uses the properties and any customizations you made as a template for the data it will generate:
[ Blend simply takes your wishes and generates a boatload of sample data ]
There is no magic behind all of this. If you look in your Projects panel, you will see a folder created for you called SampleData. Keep expanding it until you hit some XSD and XAML/CS files:
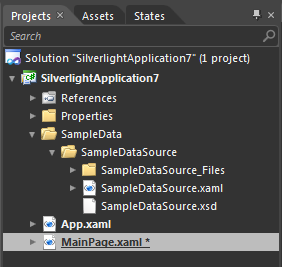
[ your sample data is stored as loose files ]
It is these files that define the schema for your data and the actual data itself. If you open your XAML file (SampleDataSource.xaml) , you will see the sample data that you see in your ListBox displayed in the form:
<SampleData:SampleDataSource.Collection>
<SampleData:Item Property1="..." Property2="..." Property3="..." />
<SampleData:Item Property1="..." Property2="..." Property3="..." />
.
.
.
<SampleData:Item Property1="..." Property2="..." Property3="..." />
</SampleData:SampleDataSource.Collection>
In the equivalent C# file (SampleDataSource.cs), you will see the backing code that actually associates the XAML types to the CLR properties:
private string _Property1 = string.Empty;
public string Property1
{
  get
  {
  return this._Property1;
  }
  set
  {
  if (this._Property1 != value)
  {
  this._Property1 = value;
  this.OnPropertyChanged("Property1");
  }
  }
}
private string _Property2 = string.Empty;
public string Property2
{
  get
  {
  return this._Property2;
  }
  set
  {
  if (this._Property2 != value)
  {
  this._Property2 = value;
  this.OnPropertyChanged("Property2");
  }
  }
}
private System.Windows.Media.ImageSource _Property3 = null;
public System.Windows.Media.ImageSource Property3
{
  get
  {
  return this._Property3;
  }
  set
  {
  if (this._Property3 != value)
  {
  this._Property3 = value;
  this.OnPropertyChanged("Property3");
  }
  }
}
The lines I highlighted in yellow define the Property and the Type of the property such as String or Image (System.Windows.Media.ImageSource).
Whenever you modify anything via the Data panel that is sample data related, code in the files seen here gets modified or even regenerated to provide Expression Blend with up-to-date visuals that you can see at both design time and (optionally) at run time.
Well, this concludes this little article that hopefully provided you with an introduction to the really cool sample data functionality found in Expression Blend. Sample data solves a very common problem that designers face when working with modern applications, and that is being able to design and visualize data that may not actually exist outside of a finished, running application.
Because this article was an introduction, some of the more interesting sample data features beyond collections and simple properties were not covered, but subsequent articles will hopefully fill in that gap.
If you are curious to see the source code for the example shown on the first page, go ahead and download it from below:
Just a final word before we wrap up. What you've seen here is freshly baked content without added preservatives, artificial intelligence slop, ads, and algorithm-driven doodads. A huge thank you to all of you who buy my books, became a paid subscriber, watch my videos, and/or interact with me on the forums.
Your support keeps this site going! 😇


:: Copyright KIRUPA 2026 //--